THE MAPPING HISTORY

Song from one of my makings—weather scribbles in sand, measurement on a chiseled stone, or scared geography in songs and art—is common to all cultures. The earliest surviving map and charts come from ancient Babylonia and Egypt. By the third Millennium B.C., both possessed the necessary mathematical and drafting skills, and the bureaucracy was responsible for the surveying and mapping of the Babylonian cartography, which was mostly partial, whereas Egyptian maps mapped mythical land and routes to afterlife
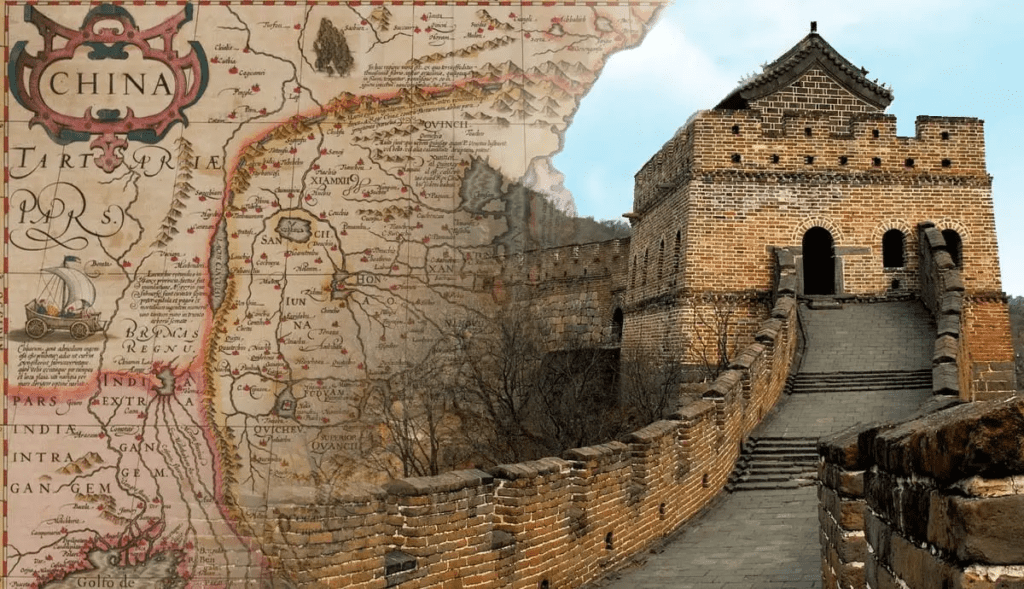
The Greeks laid the scientific foundation of Western cartography while investigating the nature of the Earth and the universe. The Romans mostly mapped properties, town plans, and roads. At the same time, the Chinese incorporated art and verbal narrative into their maps, yet they were also concerned with military planning and state security. Japan and Korea also relied on China for their world maps, adding themselves to the fringes.
Read also: THE UNIVERSE, PART-2
Religious cartography held sway in the middle Ages. Although Arabs maintained classical intellectual traditions and developed their own Islamic map-making traditions as well,.
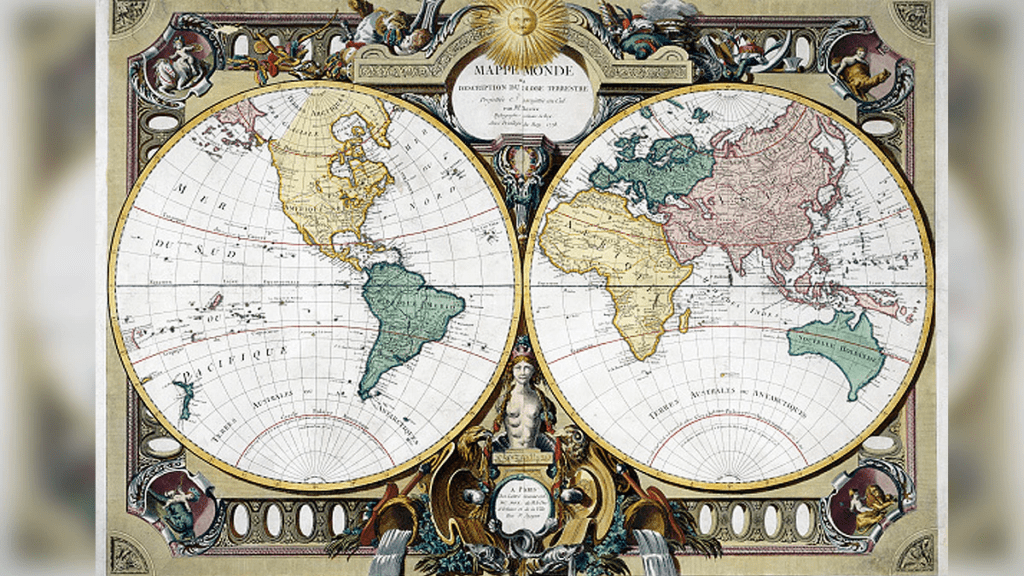
The invention of the printing press and the rediscovery of Ptolemy’s guide to geography sparked a revival in scientific cartography in western Europe, asseverated by voyages by the Spanish and Portuguese to Africa, America, and the Spice Islands. The French became the first to conduct an official land survey, producing 182 map sheets by 1787. The British adopted French technique to produce the Great Trigonometric Survey of India in the early 19th century.

Table of Contents
ORTELIUS & MERCATOR, PIONEERING MAPMAKERS
As a young Flemish scholar and geographer, Abraham Ortelius (1527–1588) was known for skillfully illuminating map manuscripts and for his collection of books and coins. Once established as a cardiographer, he revolutionized the Renaissance world with the publication in 1570 of Theatrum Orbis Terrarum, or Theater of the World. It is known as the first model atlas.
The Theatrum proved a huge success and helped transfer the center of the European map trade from Rome and Venice to Antwer, his home. when is there, and you are his home. Some 7,300 copies were printed in 31 editions and 7 languages and sold at a cost equivalent to about 1,630 dollars today, making Ortelius very wealthy.
The Theatrum include a one-page reduction of the world projection drawn by the Ortelius friend and fellow Flemish cardiographer, Gerardus Mercator, 1512–1594. First published in 1569, the Mercator projection was designed to add navigation. With all lines in latitude and longitude depicted as straight lines, mariners could more easily plot a course over a long distance.

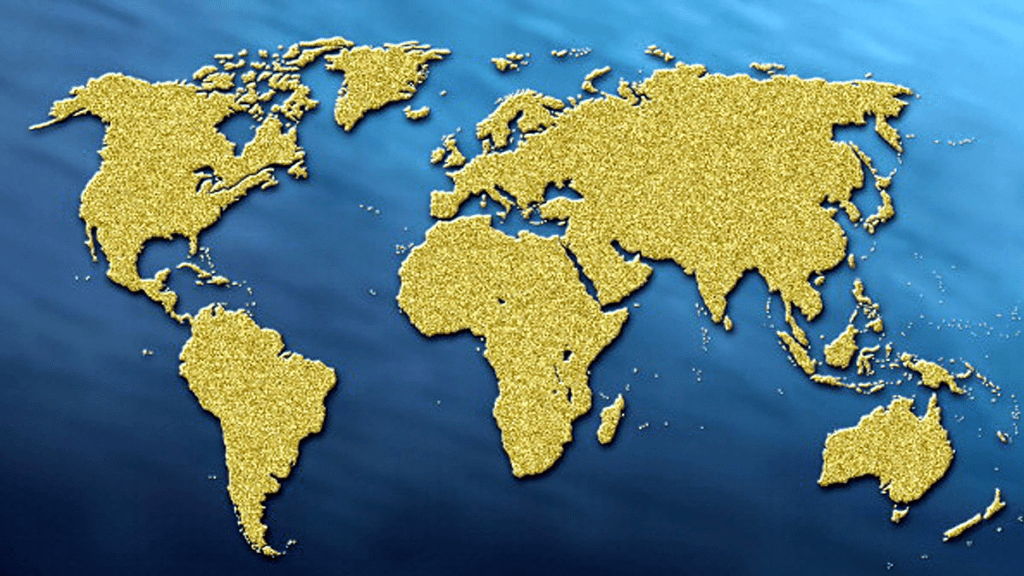
Despite its original nautical purpose, the Merator projection, with modification, became a standard two-dimensional representation of the world until well into the 20th century. Ages of schoolchildren have concentrated on Mercator projection, which persuaded them to think that Greenland and Africa were generally a similar size, in spite of the fact that they are, as a matter of fact, multiple times bigger.
Modern Maps
Scientific methods of surveying and mapping expanded greatly in the 17th, 18th, and 19th centuries, in part due to more sophisticated mathematical applications as well as rigorous and comprehensive surveys of large areas.
Surveying today often employs elements of remote sensing-obtaining information about an object or an area from a distance. Peering down on a city from the highest point of a tall structure or on a town from the highest point of a tall mountain is a type of remote detection. Map maker’s use more sophisticated methods to get similar results.
Ariel photography, used to some extent during World War 1, became widespread during World War 2 as a remote sensing tool in map-making. It eliminated much of the legwork for surveyors and allotted precise surveying to some other inaccessible places.
Remote sensing by radar, or radio waves, and Sonar, or sound waves, provides another way to record surface features of the land on the ocean floor. In both methods, distance is calculated from the time it takes to reach the target area. Remotely detected pictures fluctuate by the sort of goal they depict.
Spatial resolution refers to how sharp an image is. Greater distance is usually equated with fuzzier images.
Spectral resolution refers to which part of the light spectrum is being captured and can include such wavelengths as visible light or infrared light.
Temporal resolutions refer to the time frame represented. The technique uses sequential images of an area to show changes over a period of time.


